Case Study
An end-to-end flowsheet using the Integrated Extraction Simulator and ModelNet
31 Dec 2024
Site Profile
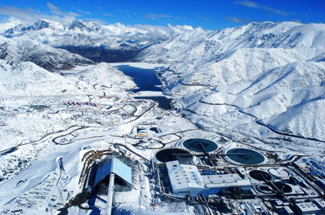
Antofagasta Minerals (AMSA) is one of the top ten largest copper producers globally with part ownership of Minera Los Pelambres (MLP), one of the world’s largest copper reserves with a operating lifetime of over 50 years.
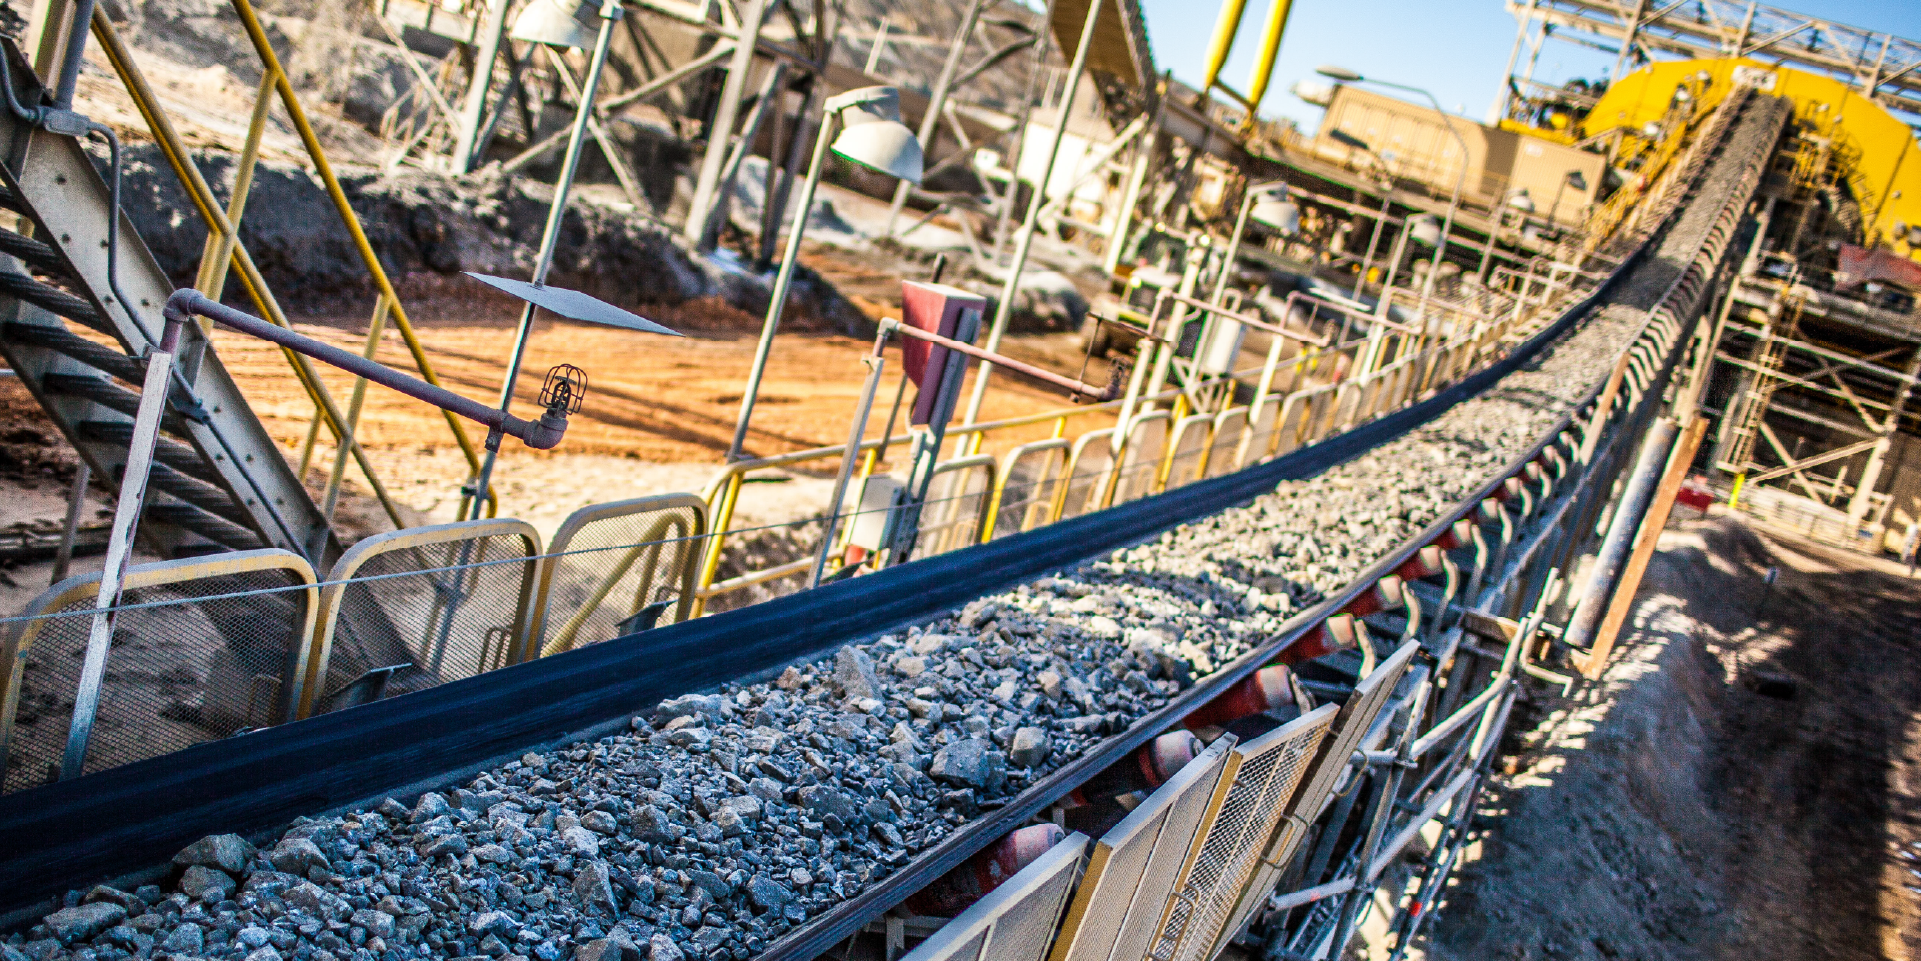
It is located in Chile’s Coquimbo region, approximately 240 km north of Santiago. It is a sulphide deposit that produces copper concentrate, including gold and silver, as well as molybdenum concentrate, using a milling and flotation process.
The situation
The AMSA MLP processing team sought a tool to rapidly evaluate processing scenarios across the mineral extraction value chain, aiming to enhance plant productivity, optimise economic value, and reduce the environmental impact of mining and mineral recovery.
Integrating all aspects of a mining operation into a single simulation platform, while allowing for optimisation across the entire mining value chain or specific segments, is a complex task. This requires not only advanced software but also a skilled team of consultants.
One specific requirement was to ensure that the flowsheet simulations accounted for real-world operational constraints. This involved adjusting equipment settings and stream parameters while applying the plant’s existing limitations to the optimisation process. The goal was to ensure that any optimisation results were practical and feasible for the actual operation, not just theoretical improvements.
Technical solutions
Orica Digital Solutions and Minera Los Pelambres worked together to tackle this challenge. Orica Digital Solutions’ Integrated Extraction Simulator (IES) was used as the enabling technology to develop an end-to-end flowsheet for the MLP site.
IES is a cloud-based multi-component modelling and simulation platform. It’s capable of running millions of simulations while combining industry-standard phenomenological models and Artificial Neural Network (ANN) models to predict the performance of blasting, comminution, and flotation circuits.
The development and delivery of the MLP flowsheet on the IES platform followed these steps:
- Phase 1: Assembly and validation of data collected from the MLP operation, including process equipment specifications, ore characteristics, and Process Information (PI), prior to configuring the flowsheet.
- Phase 2: Configuration of the initial flowsheet in the IES environment using the site-based data and existing models.
- Phase 3: Development and modification of models for the blasting, comminution, and flotation circuits by recalibrating the models or creating custom machine learning models.
- Phase 4: Fine-tuning the IES flowsheet using several months’ of operational data.
- Phase 5: Integration and validation of the flowsheet by consolidating the blasting, primary crushing, grinding, and flotation processes.
- Phase 6: Transfer of knowledge to AMSA MLP personnel, enabling them to explore various aspects of the flowsheet and use it for operational performance enhancements.
The result
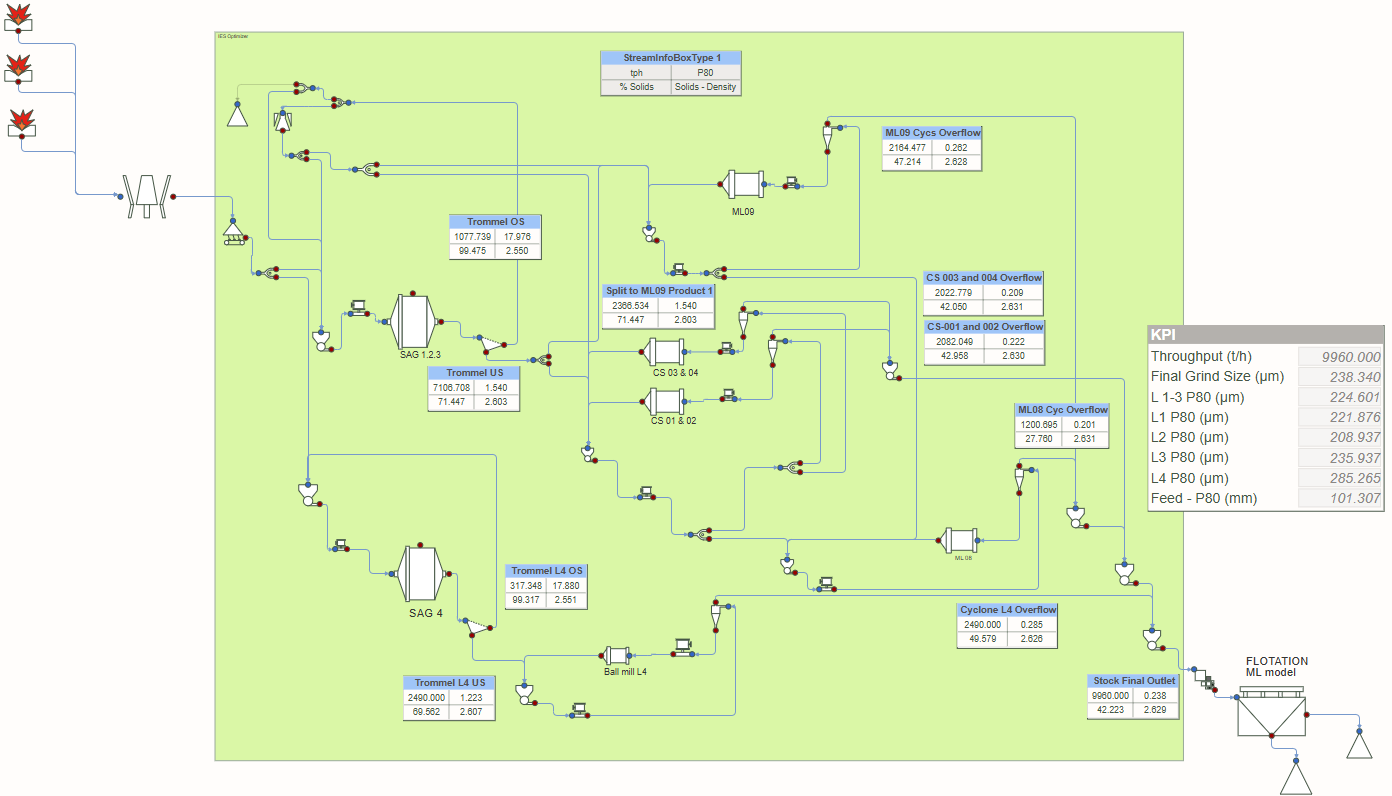
Once the flowsheet was successfully configured (refer to figure 1), it was validated using operational data from 2022, 2023, and 2024. IES model predictions for throughput, grind size, and power consumption closely matched the actual results. The flotation model was validated by predicting daily copper recovery for a specific month and comparing it with actual data. The results demonstrated a strong correlation between the model predictions and the site data.
The fine-tuned and validated flowsheet was used to simulate the 2024 half-yearly planning data. This data included ore characteristics (Axb and BWi), F80, plant shutdown hours, and targets for throughput and grind size. The IES MLP flowsheet was applied to assess whether the target throughput and grind size could be achieved under standard or optimised plant operating conditions. The simulation under standard conditions indicated that the plant would not meet the target throughput and grind size from September to December 2024.
However, under optimised conditions, key adjustments were made: the pebble crusher product was fully recycled back to the SAG mill, the SAG mill ball load was reduced to 17.5%, and an additional cyclone was added to each cluster. These optimisations successfully achieved the target throughput, as shown in Figure 2.
The final value chain flowsheet is shown in Figure 1. MLP's end-to-end flowsheet was designed with the following key features:
- The grinding flowsheet predicts throughput and grind size under standard operating conditions, taking into account specific ore hardness, grindability, and particle size distribution.
- It is used to maximise throughput at a target grind size by fine-tuning equipment operating conditions.
- The flowsheet is applicable for short, medium, and long-term mining sequence planning.
- It can also be used to condition the block model.
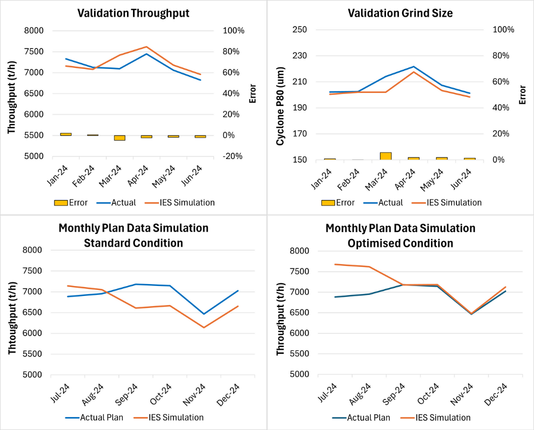
grind size, (c) Planning stage for Standard condition, (d) Planning stage for Optimised condition.
Orica Digital Solutions wishes to thank Antofagasta Minerals and Minera Los Pelambres for their support and permission to publish this case study.
Author: Paulo Lopez Pardo
Integrated Extraction Simulator
Learn more about how the Integrated Extraction Simulator can support your operations.