Digital Solutions
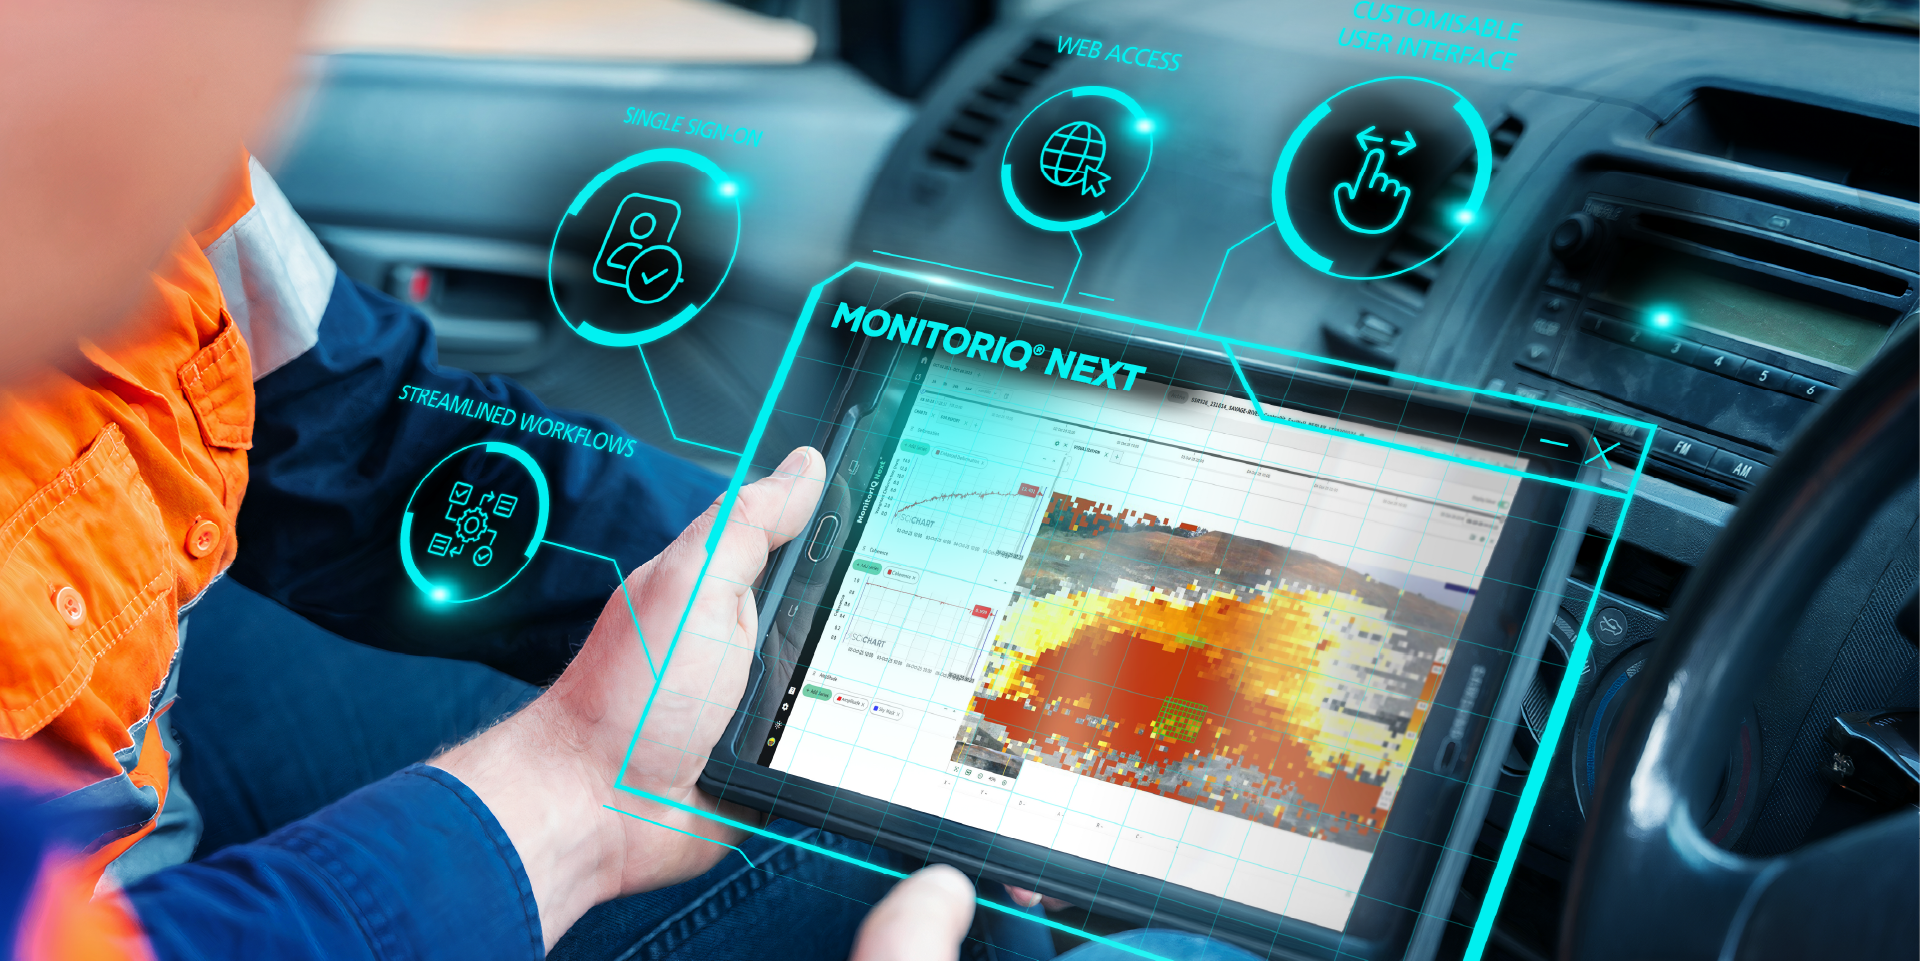
MonitorIQ® Desktop
Best-in-class geotechnical analysis platform for GroundProbe systems.
A dedicated geotechnical analysis platform.
A dedicated geotechnical analysis platform.
MonitorIQ® Desktop is our dedicated geotechnical analysis platform and the standard platform across all our GroundProbe systems and sensors.
Our MonitorIQ® Desktop software provides rapid and precise data analysis to detect trends and send alerts for immediate action.
Benefits
Benefits
Our products and services are designed to help you achieve safer, more efficient and more sustainable outcomes, wherever you operate.
Improve safety
Data insights
Social license to operate
Total cost of ownership
Features and benefits
Features and benefits
Dual-Radar View
With MonitorIQ® Desktop 2024’s Dual-Radar View, you can seamlessly analyse data from two GroundProbe radars within a single interface, eliminating the need to switch between tabs or views. This unified view enhances the user experience by consolidating essential information, making it easier to pinpoint specific georeferenced walls for analysis. You can select data for each radar, allowing for efficient and tailored analysis. Designed for continuous monitoring, this feature aids in understanding long-term behaviour and identifying root causes. It also ensures precise radar placement and comprehensive monitoring of risk areas, providing critical context to protect vital infrastructure and maintain operational safety.
Precision Atmospherics® enabled
GroundProbe’s Precision Atmospherics® is a revolutionary atmospheric correction algorithm that distinguishes and significantly reduces the noise in Slope Stability Radar (SSR) data, inherently caused by changing atmospheric conditions. It is currently available on our 2D-Real Aperture Radars: SSR-FX and SSR-Omni.
Collapse forecasting
Best-in-class charting tools
Industries
Industries
Iron ore
Surface metal
Surface coal
Construction
Quarrying
Explore more
Orica Digital Solutions’ Geosolutions, a global leader in geotechnical, geospatial and structural monitoring. We deliver a complete portfolio, from sensors to services, for mining and civil infrastructure customers. Our expertise is grounded in Orica's innovation and technical excellence that span more than 150 years.
Contact an expert
Contact an expert
Whether you need support or simply want to learn more, reach out to our Geosolutions team. We’re here to help.